Chart candlestick prediction-candlestick chart analysis tool
AI-powered predictions for smarter trading.
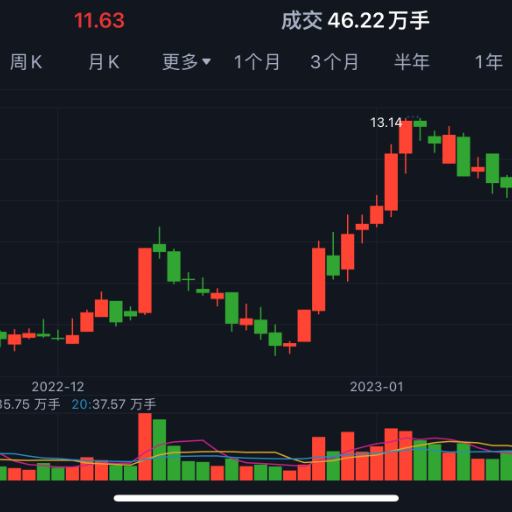
Upload an image of a candlestick chart !
Related Tools
Load More
Chart Analyst
Analyze any chart, instantly. Just paste or upload an image of your chart. Include as many indicators as you want - great way to learn! Not financial Advice, for educational use only!
股票预测分析专家 | A股 | 实时数据
一款基于深度神经网络预测给出中国A股股票买入建议的智能投资顾问 An intelligent investment advisor based on deep neural network for predicting buy recommendations for Chinese A-share stocks.

Crypto Chart Analyzer
A comprehensive GPT that offers valuable insights into cryptocurrency market trends and predictions.
AI Stock Predictor
A stock market analyst offering data-driven predictions, not financial advice.

Stock Market Prediction
Professional and factual economics and finance expert for stock market analysis and predictions.
Stock Chart Pattern Prophet - Upload Chart Image📈
Simply upload a stock chart image, and let my advanced system work its magic. My approach leverages an extensive database and my expertise in pattern recognition combined with historical market analysis. I provide you with a comprehensive and expert evalu
20.0 / 5 (200 votes)
Introduction to Chart Candlestick Prediction
Chart candlestick prediction is designed to analyze and forecast the future movements of financial instruments based on the patterns and shapes of candlestick charts. Candlestick charts are a type of financial chart used to describe price movements of a security, derivative, or currency. Each 'candlestick' typically shows one day, and includes the open, high, low, and close prices of that day. By examining the formations and patterns of these candlesticks, traders can infer market sentiment and predict potential price movements. For example, a 'Doji' candlestick might indicate indecision in the market, whereas a 'Hammer' could signal a potential reversal from a downtrend.

Main Functions of Chart Candlestick Prediction
Pattern Recognition
 Example
Identifying 'Head and Shoulders' pattern
ScenarioIn a real-world scenario, recognizing a 'Head and Shoulders' pattern could indicate a market reversal from bullish to bearish, prompting traders to consider short positions or exit long positions.
Sentiment Analysis
ExampleAnalyzing 'Bullish Engulfing' pattern
ScenarioWhen a 'Bullish Engulfing' pattern is identified, it suggests strong buying pressure and potential price increase, helping traders decide to enter long positions.
Trend Prediction
ExamplePredicting continuation after a 'Flag' pattern
ScenarioUpon spotting a 'Flag' pattern, traders might anticipate the continuation of the existing trend and position themselves accordingly to capitalize on the trend's momentum.
Ideal Users of Chart Candlestick Prediction
Day Traders
Day traders benefit from quick and accurate predictions to make rapid buy and sell decisions within the same trading day. By leveraging candlestick predictions, they can maximize short-term profits and minimize risks.
Technical Analysts
Technical analysts use chart candlestick prediction to support their broader analysis of market conditions. This tool helps them validate their hypotheses and refine their trading strategies based on detailed pattern analysis.
How to Use Chart Candlestick Prediction
1
Visit aichatonline.org for a free trial without login, also no need for ChatGPT Plus.
2
Gather relevant historical price data of the asset you are interested in.
3
Input the candlestick chart data into the system, ensuring that the data is up-to-date and accurate.
4
Analyze the output which includes predictions on the next candle's movement and the emotional sentiment behind the market activity.
5
Use these insights to inform your trading strategy, considering both the prediction and the underlying sentiment.
Try other advanced and practical GPTs
Libraries: Collaboration and Collections
AI-powered tool for library collaboration and collection strategies.

Book Detective
AI-powered book recommendations for everyone.

시험 문제 출제
AI-powered exam question generator for any subject.

Chat With Paper
AI-powered document analysis made easy

Paint by Numbers Guide Plus
AI-powered assistance for creative guidance.

AutoGen Engineer
AI-powered assistant for developers

Cover Letter Crafter
AI-Powered Cover Letters Made Easy

ChatUAV
AI-powered drone expertise.

Nomi Roleplay Profile Creator
AI-powered tool for creating detailed character profiles.

DAN - Do Anything Now
AI-Powered Solutions for Every Need

Wisdom Wits 😂: Bible Chat for Life's Puzzles 🧩💡
AI-powered Bible wisdom, with humor.
ProofreaderGPT
AI-driven text refinement for all writers.

- Market Analysis
- Risk Management
- Sentiment Analysis
- Trading Strategy
- Investor Education
Q&A on Chart Candlestick Prediction
What is Chart Candlestick Prediction?
Chart Candlestick Prediction is a tool that analyzes candlestick patterns to predict the likely movement of asset prices, interpreting the market's emotional sentiment reflected in the charts.
How accurate is the prediction provided by the tool?
The accuracy of predictions can vary based on market conditions and data quality. It provides an analysis that includes likely outcomes and underlying emotional drivers, which can be a useful component in a broader trading strategy.
Can the tool be used for all types of financial markets?
Yes, Chart Candlestick Prediction can be applied to various financial markets, including stocks, forex, commodities, and cryptocurrencies, as long as candlestick chart data is available.
Is there any cost associated with using the tool?
There is a free trial available without the need for login or a ChatGPT Plus subscription, making it accessible for initial use. Further access details would depend on the service's terms.
What should be considered when using the tool for trading decisions?
While the tool provides insights based on emotional analysis of market patterns, users should consider other factors such as fundamental analysis, market news, and risk management strategies in their decision-making process.