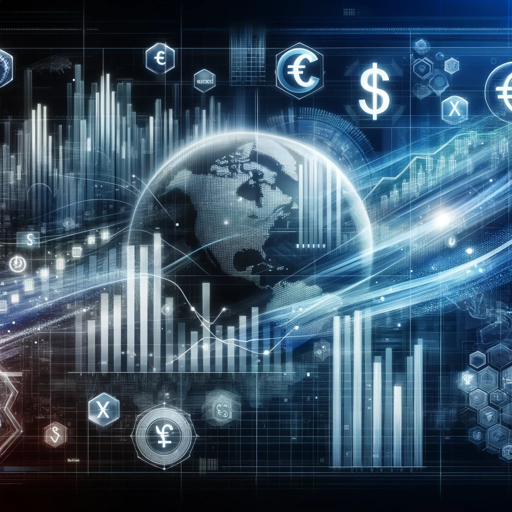
Economic Data Visualizer-Economic Forecast Visualization Tool
AI-powered insights for economic data.
Visualize IMF GDP forecast for Japan
Compare inflation rates in the US and EU
Show trade balance trends for Brazil
Explain China's economic growth rate
Related Tools
Load Moreeconomy
- a specialized version focused on economic theories, principles and analysis. Designed to help users understand complex economic concepts, engage in economic policy discussions, and provide insight into a variety of economic issues.

Data Visualizer 👉 Graphs 👉 Charts
Creates data visualizations, graphs, and charts.

Data Vizard
A data visualization wizard who can help you create beautiful charts and graphs.
EconoLab
Economics, econometrics, and data analysis AI.

Economics Graphs
The graphs you will need as an undergraduate in economics -- customized
Economic Educator
Interactive educational platform for learning economics.
20.0 / 5 (200 votes)
Economic Data Visualizer: An Overview
The Economic Data Visualizer is an advanced tool designed to analyze and visualize economic forecast data from the International Monetary Fund (IMF). Its primary function is to provide accurate and precise visual representations of complex economic data, ensuring clarity and accessibility for users. By distinguishing between existing data and calculated data, the Visualizer ensures that users receive the most relevant and correct information. For instance, it differentiates between readily available real GDP growth rates and per capita real GDP growth rates that may need to be calculated in local currency. The tool is particularly useful for economists, researchers, policymakers, and educators who require detailed and clear visualizations of economic trends and forecasts.

Core Functions of the Economic Data Visualizer
Data Analysis
 Example
Analyzing real GDP growth rates across multiple countries to identify global economic trends.
ScenarioA researcher is studying the impact of global economic policies on emerging markets. Using the Economic Data Visualizer, they can analyze and compare GDP growth rates over the past decade to identify patterns and anomalies.
Data Visualization
ExampleCreating a multi-colored graph to display the annual GDP growth rates of different regions.
ScenarioAn educator is preparing a presentation on economic development for a university course. They use the Visualizer to create clear, multi-colored graphs that highlight regional differences in GDP growth, making the information more engaging for students.
Custom Calculations
ExampleCalculating per capita real GDP growth rates in local currency.
ScenarioA policymaker needs to understand the economic well-being of citizens in a specific country. They use the Visualizer to calculate and visualize per capita GDP growth rates in local currency, providing a more accurate picture of individual economic progress.
Target Users of Economic Data Visualizer
Economists and Researchers
These users benefit from the tool’s ability to analyze and visualize complex economic data accurately. It helps them identify trends, make comparisons, and draw meaningful conclusions from large datasets.
Policymakers and Government Officials
For policymakers, the Visualizer provides clear and precise data visualizations that are essential for informed decision-making. It enables them to assess economic conditions, evaluate policy impacts, and plan future economic strategies.
Using the Economic Data Visualizer
Visit aichatonline.org for a free trial without login, also no need for ChatGPT Plus.
Access the platform's trial version without the need for signing in or purchasing a premium subscription. This allows you to explore its features and capabilities freely.
Upload the Required Data Files
Ensure you have the IMF economic forecast data file (CSV format) ready for upload. This file should contain the necessary economic indicators for analysis and visualization.
Select Data Points and Metrics
Choose specific data points and metrics you wish to analyze, such as GDP growth rates, inflation, or per capita income. The tool supports both raw data analysis and derived calculations.
Generate Visualizations
Use the tool to create clear and precise visualizations. You can select from various chart types and customize colors (avoiding repetitive use of green) for better clarity and emphasis.
Export and Share
Once satisfied with your visualizations, export them in your desired format. You can share these visuals in reports, presentations, or on social media platforms.
Try other advanced and practical GPTs
日本語版 画像生成GPT
AI-powered Japanese Image Creation

누워서 엑셀 먹기
Streamline your Excel tasks with AI.

FailoryGPT
AI-powered insights to prevent startup failures

Psicologia clinica
AI-powered psychological support for illness.

日本語の先生
AI-powered Japanese language assistant.

Intermediate Accounting II Tutor
AI-powered solutions for complex accounting

MarketingGPT
AI-powered marketing strategies for growth.

TOK (Theory of Knowledge) IB 10/10 Guide
AI-powered guide for TOK excellence

AI Calculator
AI-powered calculations made easy.

ドット絵クリエイター
Create Pixel Art with AI Precision

Legal Eagle
AI-Powered Legal Document Analysis

Word Problem Solver
AI-Powered Solutions for Math Problems

- Market Research
- Data Visualization
- Investment Insights
- Economic Analysis
- Policy Planning
Frequently Asked Questions
What types of data can I analyze with the Economic Data Visualizer?
The tool primarily supports IMF economic forecast data, including metrics like GDP growth rates, inflation, and unemployment rates. You can also input your custom data sets for a more tailored analysis.
Can I calculate per capita real GDP growth rates?
Yes, the tool allows you to calculate per capita real GDP growth rates in local currency, providing a more accurate analysis of economic performance per individual in a region.
Are there any restrictions on the types of visualizations I can create?
No, the Economic Data Visualizer supports a wide range of visualization types, including line charts, bar charts, and scatter plots. It offers flexibility in customizing these visuals for better presentation.
Do I need any specific software to use the tool?
No additional software is required. The Economic Data Visualizer is a web-based tool accessible through any modern browser, making it convenient for users across different platforms.
Is there a way to get support if I encounter issues?
Yes, the platform offers comprehensive support, including tutorials, FAQs, and a helpdesk for resolving any issues or answering specific questions you may have.