マイ@株価チャートのAnalyst-AI-driven stock chart analyzer
AI-powered insights for smarter investments.
何ができる?
4661オリエンタルランド
チャートのアドバイスが欲しい
今日の一言はなに?
Related Tools
Load More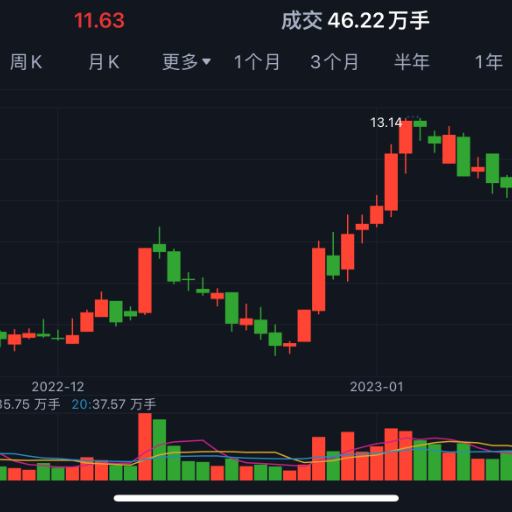
股票预测分析专家 | A股 | 实时数据
一款基于深度神经网络预测给出中国A股股票买入建议的智能投资顾问 An intelligent investment advisor based on deep neural network for predicting buy recommendations for Chinese A-share stocks.

股票分析专家
Stock analysis expert with market data access

株式投資屋(stockbroker)
企業分析、株価、業界動向、ニュースなど(日本株、外国株)

Auto Stock Analyst Expert
Tell me the stock (with ticket symbol) you want to analyze. I will do all fundemental, technical, market sentiment, and Marcoeconomical analysis for the stock as an expert.

Market Analyst
Expert in stocks, ETFs, and comprehensive market analysis.

股票趋势分析师
预测中国股市5000+股票走势
20.0 / 5 (200 votes)
Introduction to マイ@株価チャートのAnalyst
マイ@株価チャートのAnalyst is a specialized AI designed to assist investors, traders, and financial enthusiasts in analyzing stock and FX charts. The core purpose of this AI is to provide detailed technical analysis, identify trends, evaluate potential trading opportunities, and offer actionable insights based on real-time and historical data. For example, if a user uploads a candlestick chart, マイ@株価チャートのAnalyst can interpret the chart, identify bullish or bearish patterns, and suggest possible trade actions, such as buying, holding, or selling. The design is centered on giving users clear, data-driven recommendations while ensuring that the information is digestible for both novice and experienced investors.

Main Functions of マイ@株価チャートのAnalyst
Chart Analysis and Trend Diagnosis
 Example
A user uploads a chart of a specific stock, and the AI diagnoses the current trend, whether it is bullish, bearish, or neutral. The AI then provides a recommendation based on this trend analysis.
ScenarioFor instance, when a user uploads the chart of Tesla (TSLA) showing a significant price dip followed by a hammer pattern, マイ@株価チャートのAnalyst identifies this as a potential reversal signal and suggests that the stock may be approaching a buying opportunity.
Recent News and IR Information Retrieval
ExampleThe AI can search for recent investor relations (IR) reports and news that could impact a particular stock, providing a brief summary and analysis of how this information might influence the stock's price.
ScenarioA user is considering investing in Sony (6758). They input the stock code, and the AI retrieves the latest news about Sony's quarterly earnings report and analyzes its potential impact on the stock price, recommending whether the stock is likely to perform well in the near term.
Investment Advice and Recommendations
ExampleBased on chart analysis and market conditions, the AI assigns a score to a stock, reflecting its potential as a buy or sell candidate.
ScenarioWhen examining Apple's stock, the AI notices a strong upward trend and relatively low volatility. It scores the stock 8/10, indicating a strong buy, and advises the user to consider entering a position.
Ideal Users of マイ@株価チャートのAnalyst
Individual Investors
These are people who manage their own investment portfolios, ranging from beginners to experienced traders. They benefit from using the AI's chart analysis and stock recommendations to make informed decisions, especially when they need quick, data-driven insights.
Financial Advisors
Advisors who manage client portfolios can use this tool to enhance their technical analysis, quickly retrieve relevant news and IR information, and support their investment strategies with AI-backed recommendations, helping them better serve their clients.
How to Use マイ@株価チャートのAnalyst
1
Visit aichatonline.org for a free trial without login; also, no need for ChatGPT Plus.
2
Upload stock or FX chart images for trend analysis, receive evaluations and insights on trend momentum, patterns, and potential future movements.
3
Use ticker symbols or stock names to research relevant recent news and IR (Investor Relations) updates to get a comprehensive analysis of the stock's potential.
4
Apply the insights provided to make informed investment decisions, with recommendations rated on a 10-point scale indicating buy or sell potential.
5
Take advantage of personalized advice on investment strategies and timing, including the latest market trends and historical patterns, ensuring you have an edge in the market.
Try other advanced and practical GPTs
ストーリーテラー
Transform ideas into stories with AI.

Student Nemesis
AI-powered help for students and professionals

不動産コンサルタント
AI-powered tool for real estate consulting.

記事・論文解説
AI-powered tool for article analysis.

PDF Detective: Summarize & Query large PDFs
AI-powered tool for deep PDF analysis

Christian Worldview
AI-Powered Christian insights, on-demand.

株価予想
AI-driven stock predictions for smart investing.

アニメアートを自動で再評価、ブラッシュアップ。
AI-powered anime art refinement

日本株ナビゲーター
AI-powered stock market insights and analysis

Ontology Expert
AI-driven ontology extraction and modeling.

DaVinci Resolve 18.6 Wizard
AI-Powered Guidance for DaVinci Resolve

Wikipedia Editing Partner in Etiquette
AI-powered tool for better Wikipedia editing

- Risk Management
- Stock Analysis
- Investment Research
- Market Insights
- Trend Forecasting
FAQs about マイ@株価チャートのAnalyst
How does マイ@株価チャートのAnalyst analyze stock charts?
The tool analyzes uploaded stock or FX charts by identifying key trends, momentum shifts, and patterns. It considers moving averages, MACD, Bollinger Bands, and candlestick formations to assess whether the market is bullish, bearish, or neutral. It also evaluates buy or sell opportunities and provides a score out of 10.
Can マイ@株価チャートのAnalyst help with understanding recent stock news?
Yes, by inputting a stock's ticker symbol or name, the tool retrieves and summarizes recent IR reports and news that may impact the stock's price. It categorizes the news as positive or negative and assesses the overall market sentiment toward the stock.
What makes マイ@株価チャートのAnalyst different from other stock analysis tools?
マイ@株価チャートのAnalyst is designed with a user-friendly interface that doesn't require prior knowledge of technical analysis. It offers a unique, AI-powered approach that blends chart pattern recognition with the latest news, giving a holistic view of a stock's performance and potential.
Is マイ@株価チャートのAnalyst suitable for beginners?
Absolutely. The tool is designed to be accessible to beginners, providing clear explanations, trend assessments, and actionable insights. The scoring system helps users quickly understand the stock’s potential without getting overwhelmed by complex data.
How often is the data updated in マイ@株価チャートのAnalyst?
The tool constantly pulls the latest market data, ensuring that analysis and recommendations are based on real-time information. It also updates its analyses as new data becomes available, allowing users to stay on top of the latest market developments.