股票分析专家 by BiyaPay-AI-powered stock analysis tool
AI-powered insights for smarter investing.
Analyze the stock data from this web link.
What does the K-line data suggest about this stock?
Assess the stock based on this image's information.
Provide a sentiment analysis of this stock's recent news.
Related Tools
Load More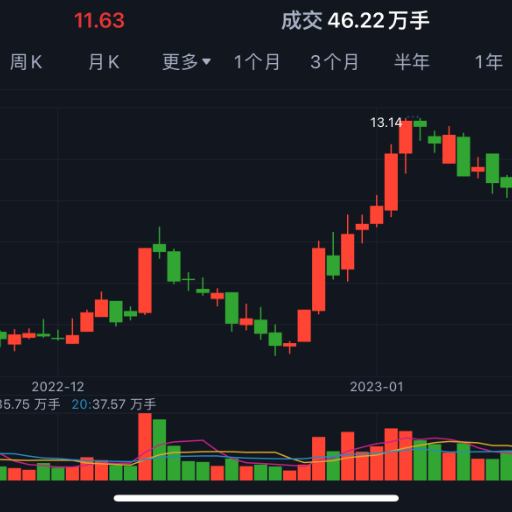
股票预测分析专家 | A股 | 实时数据
一款基于深度神经网络预测给出中国A股股票买入建议的智能投资顾问 An intelligent investment advisor based on deep neural network for predicting buy recommendations for Chinese A-share stocks.

股票分析专家
Stock analysis expert with market data access

股票智能助手
以中文提供股票市场分析和建议

Auto Stock Analyst Expert
Tell me the stock (with ticket symbol) you want to analyze. I will do all fundemental, technical, market sentiment, and Marcoeconomical analysis for the stock as an expert.

A股专家
A股实时行情查询,分析历史交易,财务数据以及资讯信息,对股价的未来走势做出预测。

股票技术分析专家
专业的股票技术分析家
20.0 / 5 (200 votes)
Introduction to 股票分析专家 by BiyaPay
股票分析专家 by BiyaPay is designed to be an advanced tool for stock market analysis, focusing on technical and news-driven insights. It enables users to examine stock price trends, interpret technical indicators (such as Moving Averages, Bollinger Bands, and Exponential Moving Averages), and synthesize real-time news and sentiment data. This tool aims to support investors by providing both quantitative and qualitative insights. For example, a user could input a stock chart image or URL to receive a breakdown of technical indicators and recent market sentiment analysis, giving them a comprehensive view of the stock’s potential movement. It is particularly useful for users looking to balance technical analysis with news sentiment to make well-informed trading decisions.

Main Functions of 股票分析专家 by BiyaPay
Technical Analysis of Stock Charts
 Example
If a user submits a URL to a stock chart or an image of one, the tool provides detailed analysis, including MA (Moving Average), EMA (Exponential Moving Average), and Bollinger Bands. It identifies trends like upward or downward momentum and overbought or oversold conditions.
ScenarioA day trader wants to quickly assess whether a stock is entering an overbought zone according to Bollinger Bands before making a short-term trade. By uploading the chart, they receive a detailed technical breakdown, including resistance and support levels.
News Sentiment and Market Insights
ExampleWhen a user requests the latest news on a stock, the tool gathers and analyzes real-time information to assess the sentiment (positive, neutral, negative) of related news articles. This analysis helps users understand if recent developments are likely to drive prices up or down.
ScenarioAn investor considering a stock purchase might first check the recent news sentiment surrounding the company. For instance, if the sentiment is highly negative due to a scandal or legal issue, they may choose to delay their purchase.
Trading Strategy Suggestions
ExampleBased on the combination of technical and news analysis, the tool provides actionable suggestions, such as whether to buy, hold, or sell a stock. It also indicates the level of risk based on market conditions and volatility.
ScenarioA user tracking a stock with a strong bullish trend based on moving averages but noticing recent negative news might receive a suggestion to wait for a potential price correction before entering a position.
Ideal Users of 股票分析专家 by BiyaPay
Active Traders
These users benefit from real-time technical indicators and news sentiment analysis. They are constantly looking for short-term opportunities and require tools that quickly aggregate data to inform rapid buy/sell decisions.
Long-term Investors
Long-term investors use the tool to evaluate the overall health and future potential of a stock by balancing technical data with news sentiment. They focus on risk management and the identification of entry or exit points based on detailed analysis over time.
How to Use 股票分析专家 by BiyaPay
Step 1
Visit aichatonline.org for a free trial without login, no need for ChatGPT Plus.
Step 2
Upload a stock-related image or enter a stock website link for analysis. The tool processes K-line data from the source.
Step 3
Review the technical analysis provided, including indicators like MA, BOLL, and EMA, which offer insights into price trends and volatility.
Step 4
Check the latest news and sentiment analysis, which combines positive and negative reports to give a well-rounded view of the stock’s performance.
Step 5
Receive a summary and investment recommendation based on technical and news analysis, with tips on potential strategies.
Try other advanced and practical GPTs
GPT Crafter
AI-powered custom prompt creator.

Machan AI
AI-powered conversations with a cultural twist.

Y Combinator Startup Assistant
AI-Powered Guidance for Startups

繁譯家
AI-powered translation for Traditional Chinese.

Laravel Expert 10.x for Japanese
AI-powered Laravel guidance for Japanese developers

Free-Hue Guide
AI-powered color technology at your fingertips

リファクタリングくん”AI. Refactoring Support Agents
AI-powered refactoring for clarity and efficiency.

Depth Psychological Analysis GPT
Uncover the depths of your mind with AI-powered psychological insights.

خبير تلخيص الكتب
AI-powered tool for quick, accurate book summaries.
Suno 日本語作詞メーカー
AI-powered Japanese Lyrics Creator.

Anglo Saxon Translator
Revive the Past with AI-Powered Translations

FP Creator
Transform your text with AI-powered precision.

- Market Trends
- Stock Analysis
- Investment Strategy
- Sentiment Analysis
- Financial News
Frequently Asked Questions about 股票分析专家 by BiyaPay
What is the primary function of 股票分析专家 by BiyaPay?
The tool specializes in analyzing stock market trends using K-line data, providing technical indicators like MA, BOLL, and EMA. It also integrates the latest market news and sentiment to offer a comprehensive stock analysis.
Can I use this tool without logging in?
Yes, you can use the tool without logging in. Simply visit aichatonline.org to access a free trial version.
Does the tool support real-time data analysis?
Yes, 股票分析专家 by BiyaPay analyzes both historical and real-time K-line data, along with up-to-date news and sentiment data.
What kind of indicators does the tool offer?
It provides key technical indicators such as Moving Averages (MA), Bollinger Bands (BOLL), and Exponential Moving Averages (EMA), which help users identify price trends and volatility.
Is the tool suitable for beginner investors?
Yes, beginner investors can easily use the tool. The analysis is comprehensive yet easy to understand, and it provides actionable recommendations.