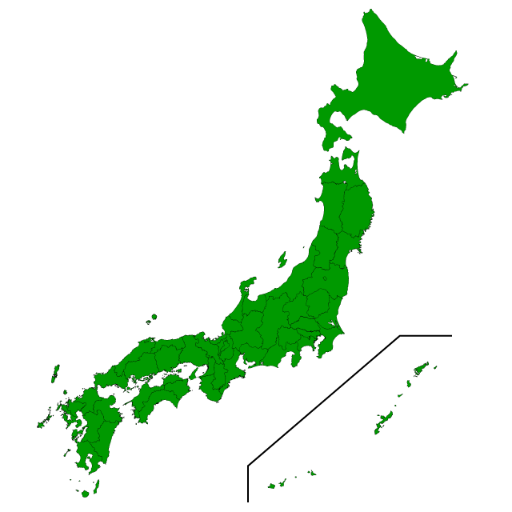
日本語グラフ作成ツール-Japanese graph creation tool
AI-powered Japanese graph creation.
Related Tools
Load More
Japanese-Japan 日本語
日本語は、日本語専用の高度なAIで、日本の文化、歴史、ビジネス、法律、および言語教育に関する深い知識を提供します。多様なアニメワイフキャラクターを通じてインタラクティブな体験を実現し、カスタマイズ可能な専門家支援と現代の日本に関する最新情報を提供することで、ユーザーの学習と情報収集を強化します。

漫画ビルダー
漫画のストーリーとセリフのお手伝い

漫画イラスト背景作成
イラスト生成し、変更等を加えます。

オリキャラプロンプト作成ツール(ちびキャラ編)

バナー生成【日本語入力可】<banner creator>
バナーを生成し、自由に文字が入力できるGPTです<You can generate a banner and enter text wherever you like.>

日本地図作成
都道府県区分した日本地図を描きます。塗分け地図(コロプレスマップ)も描けます
20.0 / 5 (200 votes)
Detailed Introduction to 日本語グラフ作成ツール
日本語グラフ作成ツール (Japanese Graph Creation Tool) is designed to cater to users seeking to generate detailed and accurate visual representations of data, all with Japanese language support. The tool is equipped with capabilities for creating graphs, embedding text, and ensuring that all elements are presented in fluent and coherent Japanese. Examples of its use include crafting business reports with pie charts labeled in Japanese, educational material with bar graphs for students, and research papers that require professional visualizations in Japanese. One of its core strengths lies in using the Noto_Sans_JP font, ensuring that the Japanese text appears clear and professional in all outputs.

Core Functions and Real-World Applications of 日本語グラフ作成ツール
Graph Creation
Example
Generating bar charts for a monthly sales report.
Scenario
A company needs to present its monthly performance data in a visually appealing format. With 日本語グラフ作成ツール, the company can create bar charts that display sales data clearly, with labels and legends written entirely in Japanese. This makes the reports more accessible for Japanese-speaking audiences.
Text Embedding
Example
Adding annotations to a pie chart in an educational presentation.
Scenario
A teacher preparing a lesson on population demographics in Japan uses the tool to create a pie chart showing different age groups. Using the text embedding feature, the teacher can annotate the chart with detailed descriptions in Japanese, ensuring that students easily understand the data.
Customization with Japanese Fonts
Example
Ensuring a graph for a formal business presentation uses Noto_Sans_JP for consistency.
Scenario
A financial analyst preparing a presentation for a Japanese audience customizes their graphs to use the Noto_Sans_JP font. This guarantees that the font matches the rest of the presentation's text, maintaining a professional appearance while ensuring that all characters render correctly and elegantly.
Target Audience of 日本語グラフ作成ツール
Business Professionals
Business users who need to create visually engaging reports, presentations, or documentation in Japanese. They benefit from the tool's ability to render precise, professional graphs that meet corporate standards while being fully localized for Japanese-speaking audiences.
Educators and Researchers
Teachers, professors, and researchers often need to convey complex data to their Japanese-speaking students or colleagues. They benefit from the tool's Japanese text support and the ability to create graphs that integrate smoothly into academic papers, presentations, or classroom materials.

Guidelines for Using 日本語グラフ作成ツール
Visit aichatonline.org for a free trial without login, also no need for ChatGPT Plus.
Begin by accessing the platform to get started without any registration or subscription requirements.
Upload your data or input your text directly.
You can upload CSV files or manually input data and text that you want to visualize.
Select the type of graph or image modification.
Choose from various graph types or image modifications, such as adding text or adjusting labels, based on your needs.
Customize the graph with Japanese fonts.
Ensure that your graph uses Noto Sans JP for Japanese text to maintain readability and consistency.
Export or download your graph.
Once satisfied with the design, you can export the graph in various formats for your use.
Try other advanced and practical GPTs
Norsk Translator
AI-powered translations for English and Norwegian Bokmål.

Backlink Auditor
AI-powered backlink analysis and insights

Korean Language Assistant
AI-powered language assistance for Korean and Spanish

Power BI & DAX Wizard
AI-Powered DAX Solutions for Power BI.

실사 이미지 프롬프트 연구자(Image Prompt Engineer) with 미드저니
Unlock Creative Realism with AI-Powered Prompts

AI 선행연구 조사
AI-powered academic research tool

SEO Article Assistant v3
AI-powered SEO content generation

バイリングルー(Bilinguru)
AI-powered translations with cultural insight.

A Level Maths Tutor
AI-powered A Level Maths assistance.

法樂多 - 台灣 AI 法務助理
AI-Powered Legal Research for Taiwan

기독교 설교문 메이커
Empower your sermons with AI-driven insights.

Review Writer
Create detailed reviews effortlessly with AI

- Data Visualization
- Image Editing
- Graph Design
- Japanese Fonts
- Web-based Tool
Frequently Asked Questions about 日本語グラフ作成ツール
What file formats are supported for data upload?
日本語グラフ作成ツール supports CSV files for data upload, allowing you to easily import structured data for graph creation.
Can I customize the appearance of graphs?
Yes, you can customize various aspects of the graph, including colors, fonts, and labels, to fit your specific needs and preferences.
Is there a limit on the amount of data I can use?
There is no strict limit, but for optimal performance, it is recommended to use datasets that are not excessively large.
Can I add multiple languages to a single graph?
While the tool is optimized for Japanese text, you can include multiple languages, but ensure that the primary font supports those languages.
Do I need to install any software to use 日本語グラフ作成ツール?
No installation is necessary. The tool is web-based and can be accessed directly through your browser.