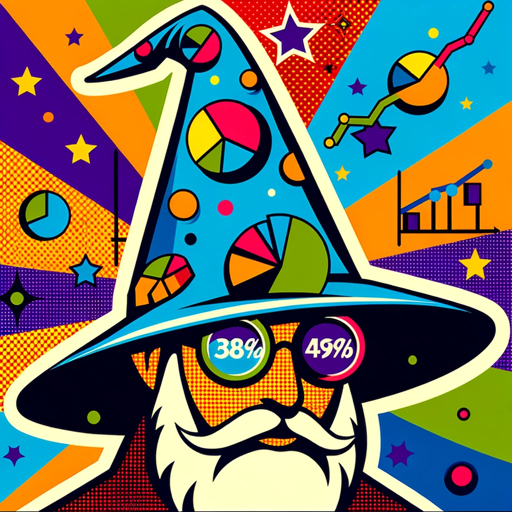
Advanced Data Visualization-Advanced Data Visualization
AI-Powered Data Visualization Tool
Related Tools
Load More
Plot AI
Specialized in the Art of Data Visualization, with a Focus on Bioinformatics Applications. Now comes with DNA Barcode Generator. **constantly updating**

Data Visualization Expert
A data viz expert specialized in creating charts and graphs from user-provided data with the knowledge to apply best practices for visual encoding, accessibility, and offer contextual suggestions for visualization types based on the provided data and inte

Data Visualizer 👉 Graphs 👉 Charts
Creates data visualizations, graphs, and charts.
Data Vizard
A data visualization wizard who can help you create beautiful charts and graphs.

数据图表匠人
我是数据图表匠人,专业将数据转化为图表。请上传想要制作图表所使用的数据,同时告知我你想要制作图表的内容和主题。

Interactive data visualization
Upload a csv or xlsx document and ask a question
20.0 / 5 (200 votes)
Introduction to Advanced Data Visualization
Advanced Data Visualization (ADV) is designed to transform complex datasets into clear, engaging, and insightful visual representations. Utilizing principles from data visualization experts like Edward Tufte and modern best practices, ADV ensures that the information is not only accessible but also aesthetically appealing and highly informative. The goal is to help users quickly grasp trends, outliers, and patterns that might be obscured in raw data. For example, ADV can turn a dense spreadsheet of financial data into a series of interactive charts that highlight key performance indicators, making it easier for stakeholders to make informed decisions.

Main Functions of Advanced Data Visualization
Interactive Dashboards
 Example
Creating a business intelligence dashboard that updates in real-time with sales, inventory, and financial data.
ScenarioA retail company uses an interactive dashboard to monitor daily sales across different regions. Managers can filter data by product category, region, or time period to identify trends and make quick decisions on stock management.
Custom Chart Types
ExampleDeveloping custom heat maps to show geographic data distribution.
ScenarioA public health organization visualizes the spread of a disease using a heat map. This helps in identifying hotspots and allocating resources efficiently. The map can be zoomed in to see detailed data for specific neighborhoods.
Data Storytelling
ExampleCreating a narrative flow using a combination of charts, text, and images to explain a complex business process.
ScenarioAn investment firm presents a quarterly report using data storytelling. They use a mix of line charts for performance trends, bar charts for sector comparisons, and annotated images to highlight key events. This approach helps clients understand the context and significance of the data.
Ideal Users of Advanced Data Visualization Services
Business Analysts
Business analysts benefit from ADV by being able to turn large datasets into actionable insights. They can use interactive dashboards and custom visualizations to track key metrics and inform strategic decisions.
Researchers and Academics
Researchers and academics use ADV to present their findings in a clear and engaging manner. Complex data from experiments or studies can be visualized in a way that highlights significant trends and makes the information accessible to a wider audience.
How to Use Advanced Data Visualization
Visit aichatonline.org for a free trial without login, also no need for ChatGPT Plus.
Begin by accessing the Advanced Data Visualization tool by visiting aichatonline.org. You can start a free trial without needing to log in or subscribe to ChatGPT Plus.
Upload Your Data
Prepare your data in a compatible format (CSV, Excel, etc.) and upload it to the platform. Ensure your data is clean and structured for the best visualization results.
Select Visualization Type
Choose the type of visualization that best suits your data and the story you want to tell. Options include bar charts, line graphs, scatter plots, heat maps, and more.
Customize Your Chart
Use the customization options to refine your visualization. Adjust colors, labels, axes, and other elements to highlight key insights and ensure clarity.
Export and Share
Once satisfied with your visualization, export it in your preferred format (JPG, HTML, GIF) and share it with your audience or incorporate it into your reports and presentations.
Try other advanced and practical GPTs
MAPAS CONCEPTUALES
AI-powered Concept Map Generation

HK-47
Your AI-driven solution for technical mastery.

Game Redeem Codes
Unlock Rewards with AI-Powered Game Codes

Digital Devil
AI-Powered Tool for Diverse Needs.

Cover Letter
AI-driven cover letters made easy

WPF Helper
AI-powered solutions for WPF coding

Radiology Eye
AI-powered Radiology Insights at Your Fingertips

Guia Juridico Brasileiro - Advogado Expert
AI-powered legal research and document formatting

Tradutor Espanhol <-> Português Brasileiro
AI-Powered Spanish-Portuguese Translation Tool

Cinematic MJ v6.0/5.2 Prompt Master
AI-Powered Cinematic Image Creation

Global Weather Forecaster
AI-Powered Accurate Weather Forecasts

Qualitative Insights
AI-Powered Qualitative Data Insights

- Academic Research
- Data Science
- Financial Reporting
- Business Analytics
- Marketing Research
Advanced Data Visualization Q&A
What types of data visualizations can I create?
You can create bar charts, line graphs, scatter plots, heat maps, pie charts, histograms, and more. Each type is suited to different kinds of data and insights.
Can I use this tool without a subscription?
Yes, you can start a free trial without needing to log in or subscribe to ChatGPT Plus. Visit aichatonline.org to get started.
What formats can I export my visualizations to?
You can export your visualizations to JPG, HTML, and GIF formats, making it easy to share your insights in presentations, reports, or online.
How do I ensure my data is compatible?
Ensure your data is in a clean and structured format, such as CSV or Excel. This will help the tool process your data accurately and generate effective visualizations.
Are there customization options available?
Yes, you can customize various elements of your charts, including colors, labels, axes, and more to enhance clarity and highlight key insights.