K 线分析预测-AI-driven market trend analysis.
AI-Powered Financial Market Predictions
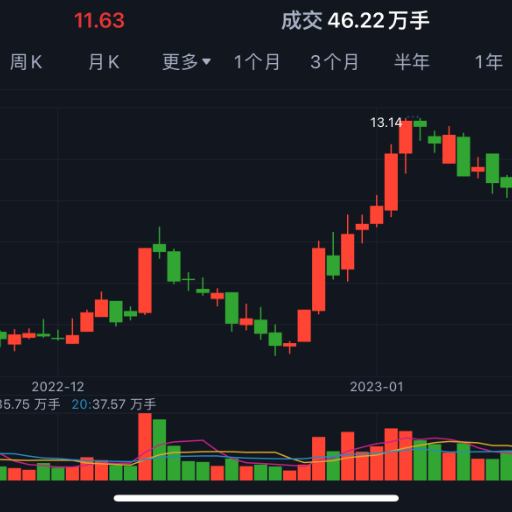
上传一张k线图 最好有k线指标
给我提示词我帮你搜索金融新闻
Related Tools
Load More
彩票助手
双色球、3D、大乐透等彩票的推测生成助手
股票预测分析专家 | A股 | 实时数据
一款基于深度神经网络预测给出中国A股股票买入建议的智能投资顾问 An intelligent investment advisor based on deep neural network for predicting buy recommendations for Chinese A-share stocks.

统计专家
精通SPSS、R语言、Python,协助数据分析和解读的统计专家。

币圈分析师
互联网币圈数据分析家
KB증권
📈🎯📚 KB증권, 투자정보 한눈에! 혁신 투자, 지금 시작하세요! 🚀

NBA高级分析师
Expert in NBA analysis & betting, primarily in Chinese.
20.0 / 5 (200 votes)
Introduction to K 线分析预测
K 线分析预测 is a specialized tool designed for analyzing and predicting financial markets, particularly focusing on cryptocurrencies and stocks. The core functionality is based on K-line charts and various technical indicators such as Bollinger Bands (BOLL), Moving Average Convergence Divergence (MACD), Volume (VOL), and Moving Averages (MA). The tool uses a combination of historical market trends and behavior data (70%) and its extensive knowledge base (30%) to provide market insights. For example, in a scenario where a trader needs to understand the potential direction of Bitcoin prices, K 线分析预测 can analyze past price movements and current market conditions using these indicators to forecast future trends.

Main Functions of K 线分析预测
Bollinger Bands (BOLL) Analysis
 Example
Identifying Overbought and Oversold Conditions
ScenarioA trader wants to know when Bitcoin might be overbought or oversold to make a buy or sell decision. By using BOLL, the tool can show when the price moves beyond the upper or lower bands, indicating potential reversal points.
MACD Analysis
ExampleSpotting Trend Changes
ScenarioAn investor is looking for signs of an upcoming trend reversal in the stock market. The MACD analysis provided by K 线分析预测 highlights crossover points of the MACD line and the signal line, signaling potential buy or sell opportunities.
Volume (VOL) Analysis
ExampleConfirming Price Movements
ScenarioA trader is monitoring a sudden price spike in Ethereum. By analyzing the volume alongside the price movement, K 线分析预测 can confirm whether the price movement is supported by strong trading activity, indicating a sustainable trend.
Moving Averages (MA) Analysis
ExampleIdentifying Support and Resistance Levels
ScenarioA long-term investor needs to identify key support and resistance levels for Apple stocks. The MA analysis helps by smoothing out price data to show average price movements over specific periods, indicating potential support and resistance zones.
Ideal Users of K 线分析预测 Services
Individual Traders
Individual traders who actively buy and sell stocks or cryptocurrencies benefit from K 线分析预测 by receiving detailed technical analysis and trend predictions, helping them make informed trading decisions based on data-driven insights.
Investment Analysts
Investment analysts use K 线分析预测 to support their research with precise technical indicators and historical data analysis, enabling them to provide more accurate investment recommendations and market forecasts to their clients.
Financial Educators
Financial educators and trainers can utilize K 线分析预测 as a teaching tool to demonstrate technical analysis techniques and market prediction methods, helping students and new traders understand complex concepts through practical examples.
Guidelines for Using K 线分析预测
Step 1
Visit aichatonline.org for a free trial without login, also no need for ChatGPT Plus.
Step 2
Navigate to the 'K 线分析预测' section and familiarize yourself with the interface and available tools.
Step 3
Input your target cryptocurrency or stock symbol to begin analysis. Ensure you have historical data for accurate predictions.
Step 4
Select the technical indicators you wish to use, such as Bollinger Bands (BOLL), MACD, Volume (VOL), and Moving Averages (MA).
Step 5
Review the generated K-line chart and interpretation. Utilize the insights for market trend analysis and decision-making.
Try other advanced and practical GPTs
Generate an image based on the reference image
AI-powered Image Generation from References

Online Course Creator
Empower Your Teaching with AI

My Tony - 发型设计师 GPT
AI-powered hairstyling, tailored for you.

给蜜
Your Playful AI Bestie

GPT API Code Companion
AI-powered coding guidance and API integration.

Xem Tarot GPT
AI-powered Tarot for Personal Guidance

Sinterklaasgedichten Generator
AI-powered tool for custom Sinterklaas poems

Video Insights: Summaries/Transcription/Vision
AI-powered video analysis for everyone

English - German Formal Translator
AI-powered English to Formal German Translation

Reflections Journal
AI-powered mindfulness and reflection.

Customer.io Liquid Helper
AI-powered Liquid code assistant for Customer.io.

Music Video Maestro
AI-powered music video creation assistant

- Analysis
- Forecasting
- Trading
- Investment
- Cryptocurrency
Frequently Asked Questions about K 线分析预测
What is K 线分析预测?
K 线分析预测 is a tool for analyzing and predicting financial market trends using K-line charts and technical indicators such as Bollinger Bands, MACD, Volume, and Moving Averages.
How can K 线分析预测 help in trading?
K 线分析预测 helps traders by providing detailed analysis of market trends and behaviors, allowing them to make informed decisions based on technical indicators and historical data.
Do I need any prior knowledge to use K 线分析预测?
While some basic understanding of financial markets and technical analysis is beneficial, K 线分析预测 is designed to be user-friendly and can be used by beginners with guidance.
What markets can I analyze with K 线分析预测?
You can analyze various financial markets, including stocks and cryptocurrencies, using K 线分析预测.
Are the predictions from K 线分析预测 accurate?
K 线分析预测 uses historical data and technical indicators to provide insights. While it can offer valuable predictions, it is important to use them as part of a broader analysis strategy.